Editors Note: This story is provided by WalletHub. Nikki Erwin, Marriage and Family Therapy Clinical Director/Lead Professor of Marriage and Family Ministry at Campbellsville University, is a contributor to the story and her information is below.
By Adam McCann, Financial Writer, WalletHub
Valentine’s Day is around the corner, and it’s a very popular time for people to get engaged. Thinking about getting married can be very stressful in the midst of the COVID-19 pandemic, though. This public health crisis has drastically altered many couples’ wedding plans or pushed them back. The good news is that the restrictions on large gatherings will eventually be loosened once a significant portion of the U.S. is able to get vaccinated this year. Therefore, engaged couples may want to begin their wedding planning now so that they will have less of a rush when things return to normal. In the aftermath of COVID-19, cost is likely to be an even bigger concern than it usually is for many couples, as millions of Americans have been financially impacted by the pandemic and may need to cut back their spending.
Weddings in the U.S. traditionally have an enormous price tag, with the average couple shelling out over $38,000 for their big day. There are so many things to purchase and organize that many couples hire professional event planners to do the heavy lifting. Between sending invitations, securing reservations, planning a menu and obsessing over final touches on the cake, it’s no wonder weddings are arranged months, even years, in advance. Tying the knot is a huge commitment, and the wedding industry is worth around $73.3 billion in revenue per year.
At WalletHub, we understand the logistical and financial stresses of that typically long march to “I do.” In order to assist with the planning process, we compared more than 180 U.S. cities to find the cheapest and most convenient wedding destinations that also promise a memorable day. We examined each city across 20 key indicators of wedding-friendliness, ranging from average wedding cost to venues and event spaces per capita to wedding vendors.
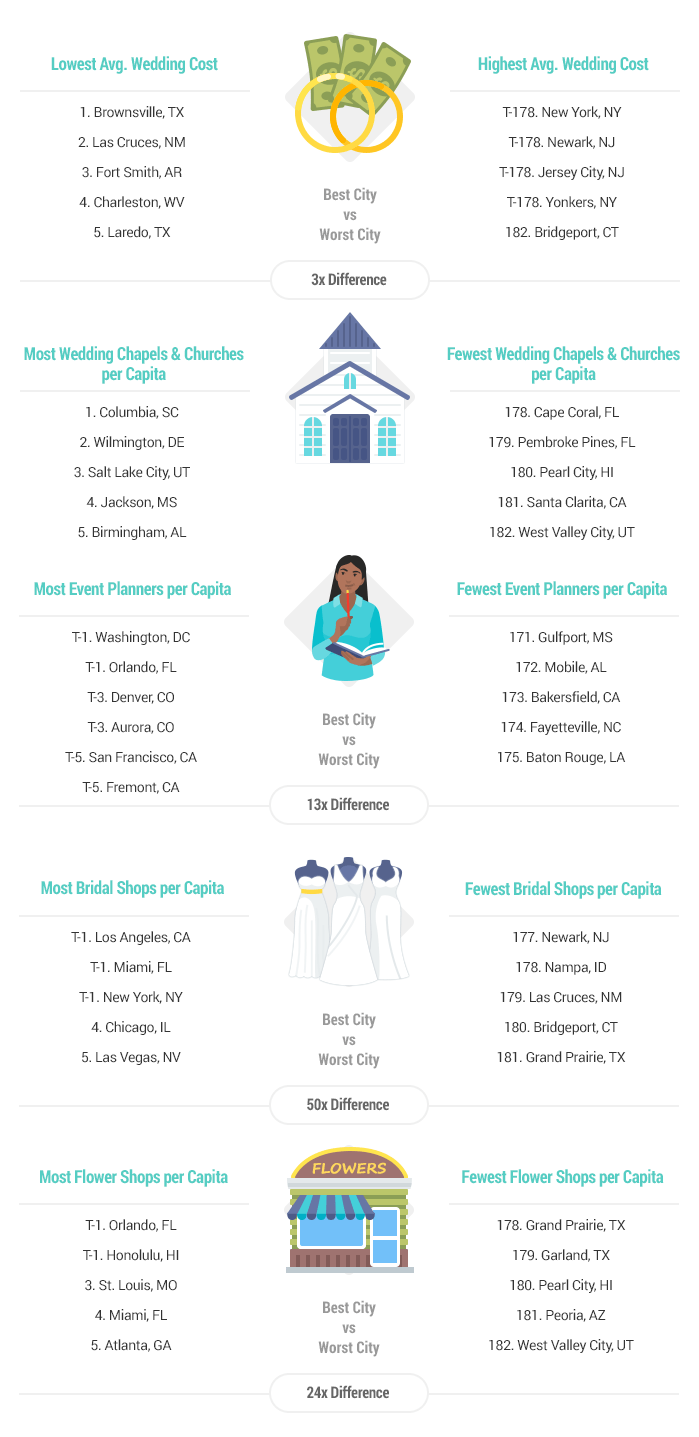
Main Findings
Best Places to Get Married in the U.S.
| Overall Rank | City | Total Score | Costs | Facilities & Services | Safety |
|---|---|---|---|---|---|
| 1 | Orlando, FL | 72.13 | 14 | 2 | 39 |
| 2 | Fayetteville, NC | 67.86 | 6 | 130 | 26 |
| 3 | Austin, TX | 65.29 | 61 | 11 | 28 |
| 4 | Portland, OR | 64.80 | 114 | 20 | 8 |
| 5 | Charleston, WV | 64.24 | 2 | 142 | 79 |
| 6 | Kansas City, MO | 63.59 | 77 | 67 | 12 |
| 7 | Atlanta, GA | 62.95 | 66 | 5 | 46 |
| 8 | Vancouver, WA | 62.86 | 120 | 49 | 7 |
| 9 | Tampa, FL | 62.61 | 35 | 17 | 47 |
| 10 | San Francisco, CA | 61.62 | 162 | 4 | 6 |
| 11 | Cincinnati, OH | 61.22 | 51 | 26 | 41 |
| 12 | Newport News, VA | 60.81 | 70 | 146 | 16 |
| 13 | Seattle, WA | 60.67 | 137 | 13 | 11 |
| 14 | Raleigh, NC | 60.18 | 98 | 48 | 24 |
| 15 | Virginia Beach, VA | 60.14 | 89 | 89 | 19 |
| 16 | Lewiston, ME | 60.01 | 103 | 182 | 10 |
| 17 | Las Vegas, NV | 59.84 | 17 | 3 | 138 |
| 18 | Richmond, VA | 59.83 | 115 | 32 | 22 |
| 19 | Honolulu, HI | 59.82 | 171 | 9 | 1 |
| 20 | Durham, NC | 59.67 | 92 | 80 | 23 |
| 21 | Norfolk, VA | 59.39 | 80 | 135 | 20 |
| 22 | Knoxville, TN | 59.27 | 7 | 73 | 97 |
| 23 | Salem, OR | 59.24 | 81 | 128 | 21 |
| 24 | Boise, ID | 59.22 | 5 | 84 | 100 |
| 25 | Portland, ME | 59.12 | 127 | 86 | 9 |
| 26 | Greensboro, NC | 59.01 | 48 | 112 | 33 |
| 27 | Houston, TX | 58.45 | 99 | 19 | 34 |
| 28 | Charleston, SC | 57.93 | 84 | 28 | 44 |
| 29 | Spokane, WA | 57.77 | 49 | 87 | 48 |
| 30 | Charlotte, NC | 57.53 | 64 | 47 | 45 |
| 31 | St. Louis, MO | 57.38 | 74 | 24 | 62 |
| 32 | Tulsa, OK | 57.09 | 10 | 109 | 93 |
| 33 | Sacramento, CA | 57.08 | 134 | 8 | 29 |
| 34 | Albuquerque, NM | 56.93 | 26 | 99 | 74 |
| 35 | Tacoma, WA | 56.87 | 137 | 60 | 13 |
| 36 | Missoula, MT | 56.74 | 93 | 96 | 31 |
| 37 | Oklahoma City, OK | 56.60 | 31 | 91 | 78 |
| 38 | Columbia, SC | 56.40 | 42 | 44 | 87 |
| 39 | Huntington, WV | 56.36 | 13 | 178 | 80 |
| 40 | St. Petersburg, FL | 56.10 | 40 | 95 | 69 |
| 41 | Chattanooga, TN | 55.84 | 12 | 88 | 118 |
| 42 | Grand Rapids, MI | 55.81 | 56 | 51 | 71 |
| 43 | Lexington-Fayette, KY | 55.76 | 45 | 119 | 61 |
| 44 | Chesapeake, VA | 55.72 | 106 | 139 | 27 |
| 45 | Winston-Salem, NC | 55.50 | 59 | 149 | 40 |
| 46 | Plano, TX | 55.42 | 110 | 70 | 30 |
| 47 | Gulfport, MS | 55.32 | 37 | 167 | 63 |
| 48 | Fort Lauderdale, FL | 55.21 | 63 | 21 | 98 |
| 49 | San Diego, CA | 55.18 | 143 | 6 | 35 |
| 50 | Columbus, GA | 55.08 | 34 | 154 | 76 |
| 51 | Dallas, TX | 55.04 | 86 | 29 | 77 |
| 52 | Fresno, CA | 54.99 | 25 | 65 | 101 |
| 53 | Columbus, OH | 54.80 | 97 | 83 | 38 |
| 54 | Juneau, AK | 54.69 | 172 | 175 | 3 |
| 55 | Memphis, TN | 54.59 | 9 | 121 | 117 |
| 56 | Madison, WI | 54.58 | 108 | 94 | 32 |
| 57 | Oakland, CA | 54.39 | 161 | 22 | 14 |
| 58 | Springfield, MO | 54.17 | 19 | 110 | 110 |
| 59 | Cleveland, OH | 54.14 | 94 | 58 | 53 |
| 60 | Reno, NV | 54.02 | 32 | 43 | 121 |
| 61 | Tallahassee, FL | 53.97 | 57 | 93 | 73 |
| 62 | Wichita, KS | 53.78 | 39 | 126 | 83 |
| 63 | Salt Lake City, UT | 53.74 | 96 | 10 | 102 |
| 64 | South Burlington, VT | 53.68 | 176 | 151 | 4 |
| 65 | Las Cruces, NM | 53.54 | 1 | 172 | 150 |
| 66 | Mobile, AL | 53.43 | 27 | 104 | 113 |
| 67 | Pittsburgh, PA | 53.22 | 124 | 34 | 50 |
| 68 | Colorado Springs, CO | 52.98 | 101 | 74 | 54 |
| 69 | Huntsville, AL | 52.93 | 87 | 131 | 51 |
| 70 | Birmingham, AL | 52.75 | 18 | 56 | 133 |
| 71 | Burlington, VT | 52.61 | 164 | 124 | 4 |
| 72 | Jacksonville, FL | 52.48 | 72 | 72 | 84 |
| 73 | San Jose, CA | 52.48 | 165 | 15 | 25 |
| 74 | Port St. Lucie, FL | 52.26 | 24 | 179 | 88 |
| 75 | Santa Rosa, CA | 52.23 | 156 | 46 | 17 |
| 76 | Cape Coral, FL | 52.14 | 68 | 165 | 64 |
| 77 | North Las Vegas, NV | 51.99 | 15 | 38 | 138 |
| 78 | Cheyenne, WY | 51.97 | 65 | 174 | 70 |
| 79 | Denver, CO | 51.88 | 122 | 16 | 82 |
| 80 | Lincoln, NE | 51.77 | 105 | 108 | 49 |
| 81 | Louisville, KY | 51.56 | 75 | 81 | 89 |
| 82 | Jackson, MS | 51.16 | 44 | 143 | 114 |
| 83 | Bakersfield, CA | 51.07 | 78 | 78 | 90 |
| 84 | Overland Park, KS | 50.96 | 76 | 125 | 81 |
| 85 | Toledo, OH | 50.84 | 41 | 145 | 112 |
| 86 | Akron, OH | 50.73 | 55 | 148 | 91 |
| 87 | Billings, MT | 50.58 | 46 | 118 | 116 |
| 88 | Des Moines, IA | 50.57 | 53 | 106 | 108 |
| 89 | Tucson, AZ | 50.50 | 21 | 61 | 148 |
| 90 | Fort Worth, TX | 50.21 | 95 | 75 | 86 |
| 91 | Chula Vista, CA | 50.20 | 135 | 77 | 35 |
| 92 | Baton Rouge, LA | 49.80 | 82 | 62 | 107 |
| 93 | Henderson, NV | 49.63 | 30 | 102 | 138 |
| 94 | Little Rock, AR | 49.43 | 69 | 113 | 106 |
| 95 | Santa Ana, CA | 49.38 | 142 | 37 | 55 |
| 96 | Minneapolis, MN | 49.00 | 116 | 45 | 92 |
| 97 | Pembroke Pines, FL | 48.81 | 91 | 103 | 98 |
| 98 | Montgomery, AL | 48.67 | 33 | 161 | 127 |
| 99 | San Antonio, TX | 48.58 | 112 | 50 | 96 |
| 100 | Fremont, CA | 48.52 | 179 | 54 | 14 |
| 101 | Anaheim, CA | 48.45 | 148 | 25 | 55 |
| 102 | Pearl City, HI | 48.11 | 181 | 180 | 1 |
| 103 | Oceanside, CA | 47.93 | 147 | 68 | 35 |
| 104 | Columbia, MD | 47.83 | 166 | 150 | 18 |
| 105 | Dover, DE | 47.74 | 119 | 166 | 68 |
| 106 | Fargo, ND | 47.65 | 38 | 140 | 144 |
| 107 | Nampa, ID | 47.34 | 22 | 170 | 135 |
| 108 | Tempe, AZ | 47.23 | 54 | 35 | 161 |
| 109 | New Orleans, LA | 47.17 | 100 | 52 | 122 |
| 110 | Indianapolis, IN | 47.16 | 71 | 79 | 126 |
| 111 | Corpus Christi, TX | 47.15 | 43 | 141 | 145 |
| T-112 | Miami, FL | 47.08 | 67 | 1 | 175 |
| T-112 | Buffalo, NY | 47.08 | 123 | 71 | 94 |
| 114 | Irvine, CA | 46.87 | 158 | 31 | 55 |
| 115 | Fort Wayne, IN | 46.86 | 47 | 127 | 137 |
| 116 | Augusta, GA | 46.85 | 23 | 132 | 152 |
| 117 | Irving, TX | 46.80 | 102 | 111 | 111 |
| 118 | Rochester, NY | 46.53 | 146 | 57 | 60 |
| 119 | Nashville, TN | 46.19 | 85 | 42 | 146 |
| 120 | Huntington Beach, CA | 45.94 | 159 | 33 | 55 |
| 121 | Omaha, NE | 45.91 | 90 | 92 | 124 |
| 122 | Aurora, CO | 45.82 | 139 | 98 | 67 |
| 123 | Rapid City, SD | 45.57 | 20 | 156 | 160 |
| 124 | Garden Grove, CA | 45.33 | 152 | 66 | 55 |
| 125 | Glendale, AZ | 45.21 | 28 | 134 | 161 |
| 126 | Detroit, MI | 45.18 | 79 | 97 | 136 |
| 127 | Anchorage, AK | 45.08 | 150 | 144 | 42 |
| 128 | Garland, TX | 44.84 | 128 | 153 | 85 |
| 129 | Chicago, IL | 44.81 | 117 | 30 | 143 |
| 130 | Arlington, TX | 44.79 | 107 | 114 | 119 |
| 131 | Gilbert, AZ | 44.64 | 36 | 116 | 161 |
| 132 | Casper, WY | 44.63 | 88 | 160 | 125 |
| 133 | Washington, DC | 44.59 | 170 | 27 | 52 |
| 134 | West Valley City, UT | 44.42 | 104 | 176 | 102 |
| 135 | Stockton, CA | 44.26 | 129 | 138 | 95 |
| 136 | Rancho Cucamonga, CA | 43.65 | 111 | 64 | 128 |
| 137 | Cedar Rapids, IA | 43.51 | 130 | 133 | 104 |
| 138 | Chandler, AZ | 43.33 | 58 | 107 | 161 |
| 139 | Modesto, CA | 43.05 | 113 | 85 | 132 |
| 140 | Fort Smith, AR | 43.02 | 50 | 177 | 159 |
| 141 | St. Paul, MN | 42.97 | 136 | 82 | 105 |
| 142 | Brownsville, TX | 42.69 | 11 | 181 | 172 |
| 143 | Baltimore, MD | 42.59 | 157 | 63 | 75 |
| 144 | Riverside, CA | 42.57 | 126 | 40 | 141 |
| 145 | Phoenix, AZ | 42.49 | 83 | 76 | 161 |
| 146 | Shreveport, LA | 42.23 | 29 | 151 | 170 |
| 147 | Mesa, AZ | 41.67 | 73 | 105 | 161 |
| 148 | Aurora, IL | 41.50 | 141 | 117 | 109 |
| 149 | Los Angeles, CA | 41.45 | 144 | 7 | 154 |
| 150 | Oxnard, CA | 41.43 | 168 | 122 | 43 |
| 151 | Milwaukee, WI | 41.42 | 125 | 90 | 134 |
| 152 | Scottsdale, AZ | 41.27 | 121 | 36 | 161 |
| 153 | El Paso, TX | 41.22 | 3 | 115 | 182 |
| 154 | San Bernardino, CA | 41.10 | 118 | 137 | 128 |
| 155 | Glendale, CA | 40.91 | 131 | 14 | 154 |
| 156 | Grand Prairie, TX | 40.07 | 132 | 173 | 115 |
| 157 | Manchester, NH | 39.87 | 163 | 159 | 65 |
| 158 | Fontana, CA | 38.76 | 133 | 123 | 128 |
| 159 | Philadelphia, PA | 38.57 | 153 | 53 | 123 |
| 160 | Hialeah, FL | 38.29 | 52 | 69 | 175 |
| 161 | Laredo, TX | 38.22 | 4 | 169 | 180 |
| 162 | Nashua, NH | 38.16 | 175 | 163 | 65 |
| 163 | Wilmington, DE | 37.80 | 180 | 39 | 72 |
| 164 | Long Beach, CA | 37.74 | 148 | 23 | 154 |
| 165 | Amarillo, TX | 37.69 | 8 | 164 | 179 |
| 166 | Ontario, CA | 37.59 | 145 | 101 | 128 |
| 167 | Peoria, AZ | 37.38 | 109 | 171 | 158 |
| 168 | Sioux Falls, SD | 36.86 | 62 | 162 | 174 |
| 169 | Moreno Valley, CA | 36.67 | 140 | 147 | 141 |
| 170 | Lubbock, TX | 36.50 | 16 | 129 | 181 |
| 171 | Warwick, RI | 34.44 | 177 | 155 | 120 |
| 172 | Santa Clarita, CA | 34.27 | 151 | 59 | 154 |
| 173 | Bismarck, ND | 33.57 | 60 | 157 | 178 |
| 174 | New Haven, CT | 33.08 | 155 | 136 | 147 |
| 175 | Worcester, MA | 32.12 | 154 | 158 | 151 |
| 176 | New York, NY | 31.79 | 174 | 18 | 169 |
| 177 | Boston, MA | 31.78 | 169 | 41 | 153 |
| 178 | Bridgeport, CT | 29.20 | 167 | 168 | 149 |
| 179 | Yonkers, NY | 28.24 | 182 | 12 | 168 |
| 180 | Newark, NJ | 25.93 | 173 | 100 | 171 |
| 181 | Jersey City, NJ | 24.08 | 178 | 54 | 173 |
| 182 | Providence, RI | 22.09 | 160 | 120 | 177 |
Note: With the exception of “Total Score,” all of the columns in the table above depict the relative rank of that city, where a rank of 1 represents the best conditions for that metric category.
Ask the Experts
Marriage is not only a big life decision, but it also can be a hefty financial commitment, because how much money you have usually determines the extravagance and location of the wedding. But some couples have far fewer resources to spend on their special day. For advice on such matters and how to boost the local economy through the wedding business, we turned to a panel of experts in family studies, personal finance and local administration. Click on the experts’ profiles to read their bios and thoughts on the following key questions:
- What factors should couples consider when setting a budget for their wedding?
- How should a couple decide where to get married?
- What tips do you have for a couple planning a wedding and hoping to stay on budget?
- What will it take to get venues and bridal shops back on track in 2021?
- Weddings can often be an economic boost to local businesses. What can local authorities do to encourage weddings in their communities?

I strongly urge couples to seek pre-marital counseling. I use the Prepare-Enrich inventory and teaching materials with these couples. It does factor in the financial, including wedding expenses and stress. This pre-marital approach has solid research over 50K plus couples for decades. It has been proven that the divorce rate for couples who complete the course have a 50% reduction in divorce rates over the general population. It deals with compatibility, communication, roles, sex, conflict, and family of origin factors.
I encourage couples to decide together on what they want for their wedding and to set boundaries with family members who try to make it their wedding instead of the couple. The family has the experience for the moment, but the couple makes memories for a lifetime.
Bottom line, couples should put more time and energy into the relationship than they do planning the wedding. The investment should be in the connection and the wedding should be a celebration of that.
Methodology
In order to identify the best and worst cities in which to tie the knot, WalletHub compared 182 cities — including the 150 most populated U.S. cities, plus at least two of the most populated cities in each state — across three key dimensions: 1) Costs, 2) Facilities & Services and 3) Safety.
We examined those dimensions using 20 relevant metrics, which are listed below with their corresponding weights. Each metric was graded on a 100-point scale, with a score of 100 representing the most favorable conditions for weddings. For metrics marked with an asterisk (*), we used the square root of the population to calculate the population size in order to avoid overcompensating for minor differences across cities.
We then determined each city’s weighted average across all metrics to calculate its overall score and used the resulting scores to rank-order our sample.
Costs – Total Points: 40
- Average Wedding Cost: Triple Weight (~24.00 Points)
- Restaurant-Meal Costs: Full Weight (~8.00 Points)
Note: “Restaurant Meal” refers to a three-course meal for two. - Prevalence of Affordable Wedding Logistics: Full Weight (~8.00 Points)
Note: This metric measures the prevalence of affordable restaurants and wedding venues with ratings of at least 4.5 stars.
Facilities & Services – Total Points: 20
- Wedding Chapels & Churches per Capita*: Full Weight (~1.29 Points)
- Venues & Event Spaces per Capita*: Full Weight (~1.29 Points)
- Party-Equipment Rentals per Capita*: Full Weight (~1.29 Points)
- Photo Booth Rentals per Capita*: Half Weight (~0.65 Points)
- Event Planners per Capita: Full Weight (~1.29 Points)
- Videographers & Photographers per Capita: Full Weight (~1.29 Points)
- Musicians & DJs per Capita: Full Weight (~1.29 Points)
- Makeup Artists & Hair Salons per Capita*: Full Weight (~1.29 Points)
- Bridal Shops per Capita*: Full Weight (~1.29 Points)
- Flower & Gift Shops per Capita*: Full Weight (~1.29 Points)
- Catering Companies per Capita*: Full Weight (~1.29 Points)
- Availability of Highly-Rated Takeout or Delivery Food: Double Weight (~2.58 Points)
Note: This is a composite metric which includes delivery and takeout restaurant options rated 4 stars or higher. - Bartenders per Capita*: Full Weight (~1.29 Points)
- Floral Designers per Capita*: Full Weight (~1.29 Points)
- Cake Shops per Capita*: Full Weight (~1.29 Points)
Safety – Total Points: 40
- Average COVID-19 Deaths in the Past Week per Capita: Double Weight (~20.00 Points)
- Average COVID-19 Cases in the Past Week per Capita: Double Weight (~20.00 Points)